How it works
What would have happened if you had made different energy decisions?
Instead of estimates, we use your real half-hourly data and replay it against tariffs, solar, and battery behaviour — on the same timeline.
Each layer builds on the last.
We model your energy future in three steps. Each layer uses the same underlying data, so the interactions are realistic.
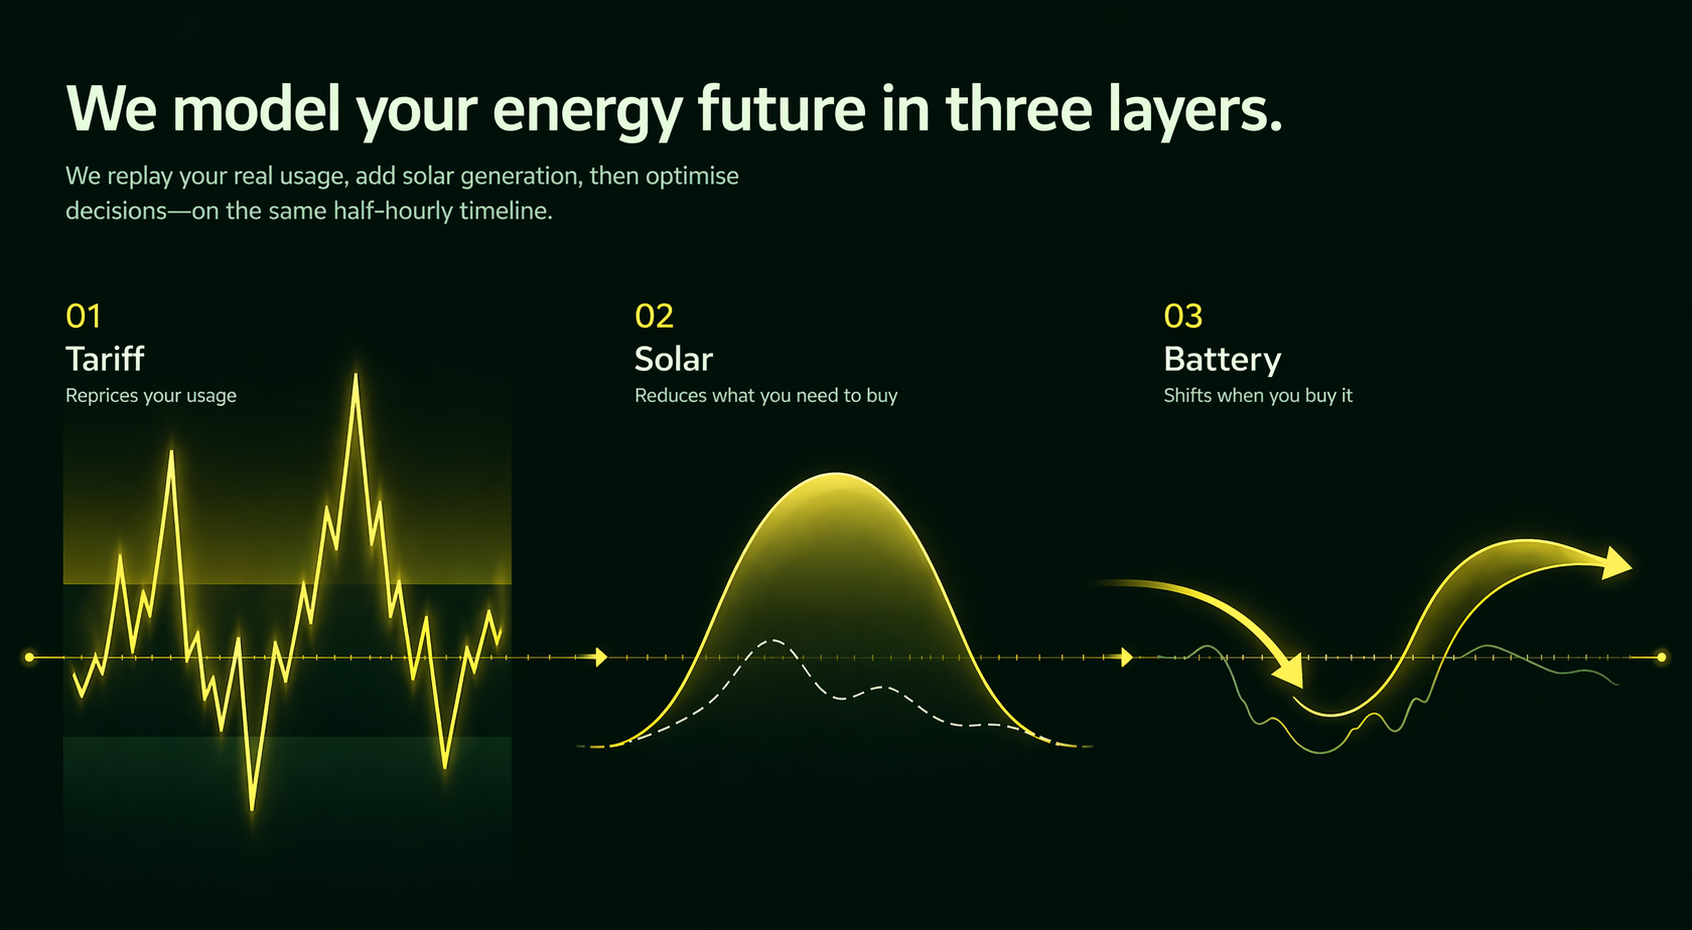
- Step 1
Tariff
How your usage is priced.
- Step 2
Solar
How much energy you would generate.
- Step 3
Battery
When that energy is used.
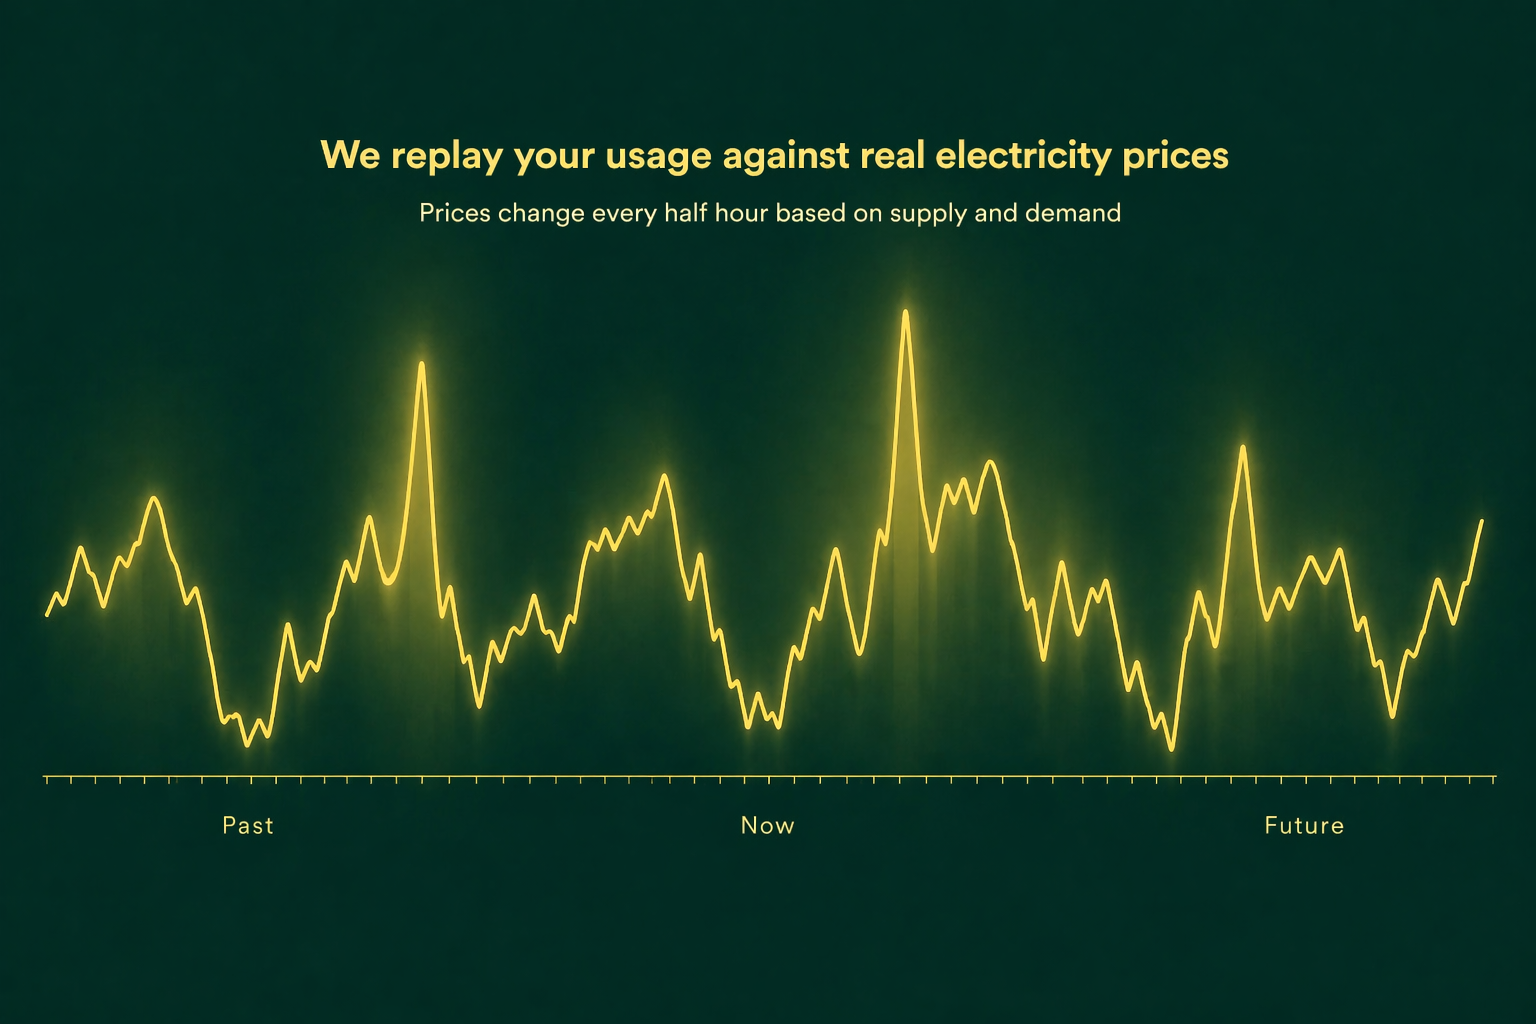
1. Tariffs
The price changes every half hour.
Electricity isn't priced once per day — it changes every 30 minutes. Prices rise and fall based on:
- Demand (morning and evening peaks)
- Supply (wind, solar, gas)
- Grid constraints
As more renewables come online, this volatility increases:
- Prices can be very low when supply is abundant
- And spike sharply when demand is high
We replay your exact usage against these real price patterns to show:
What you would have paid under different tariffs.
Same behaviour. Different pricing.
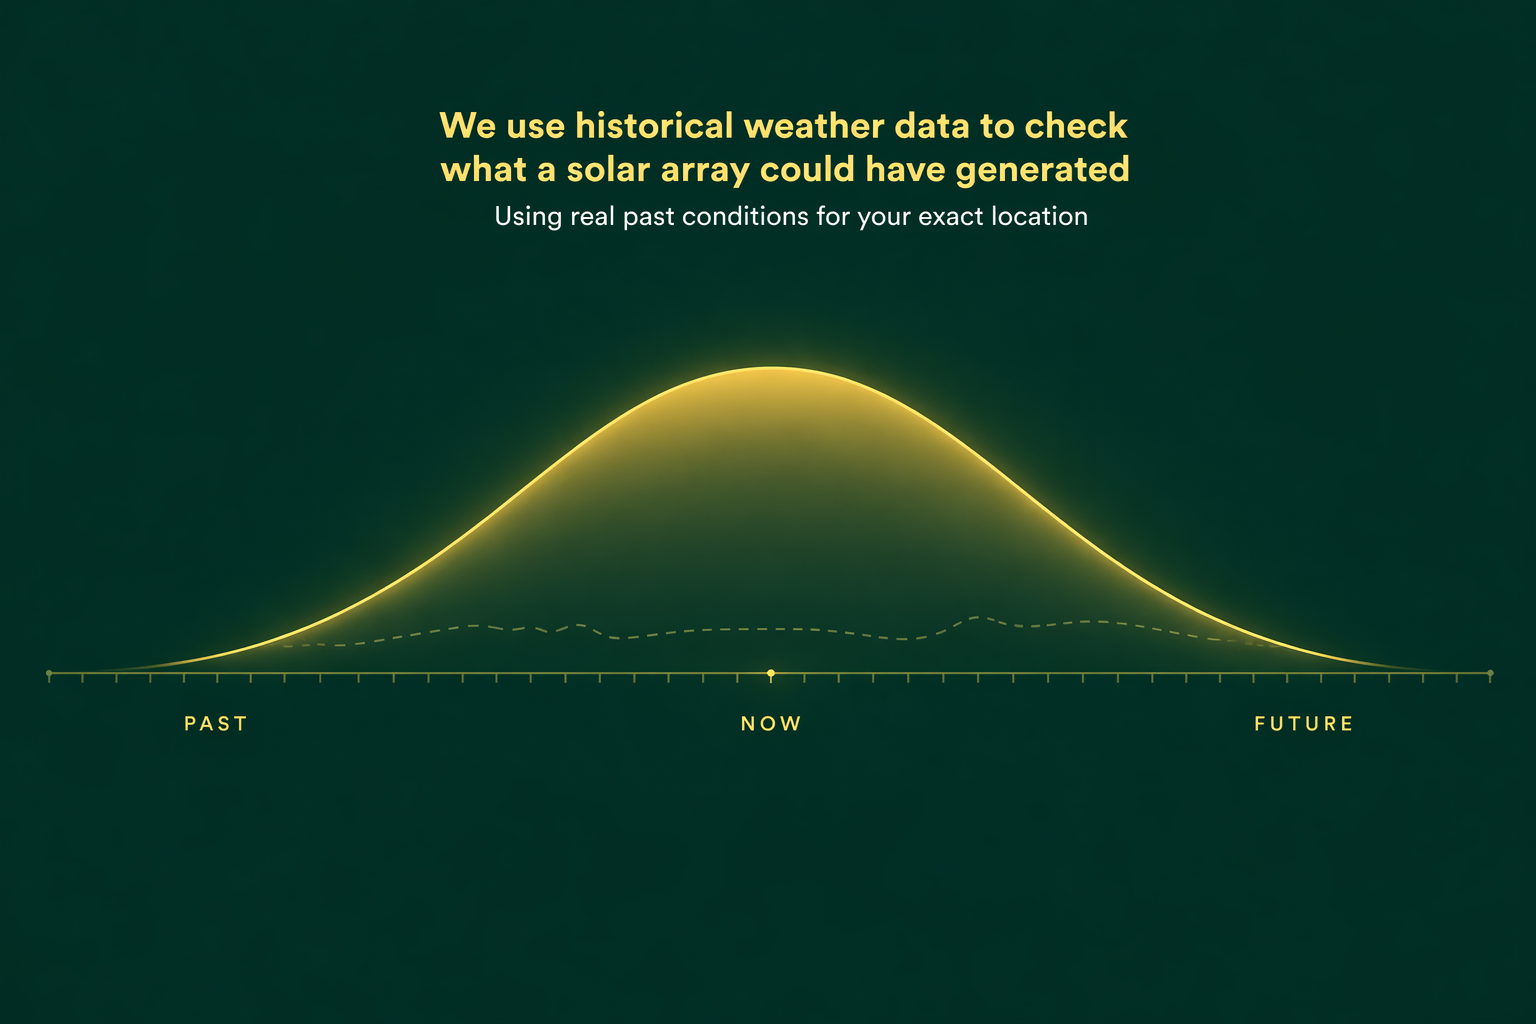
2. Solar
What your system would have generated.
We reconstruct solar generation using historical weather data for your exact location. That means:
- Real sunlight patterns
- Real seasons
- Real variability
From this, we calculate:
How much energy your solar system would have generated, hour by hour.
We then compare that directly to your actual usage:
- When you would have used your own energy
- When you would have exported excess
- When you would still need to import
No averages. No “typical year”. Just your data, replayed.
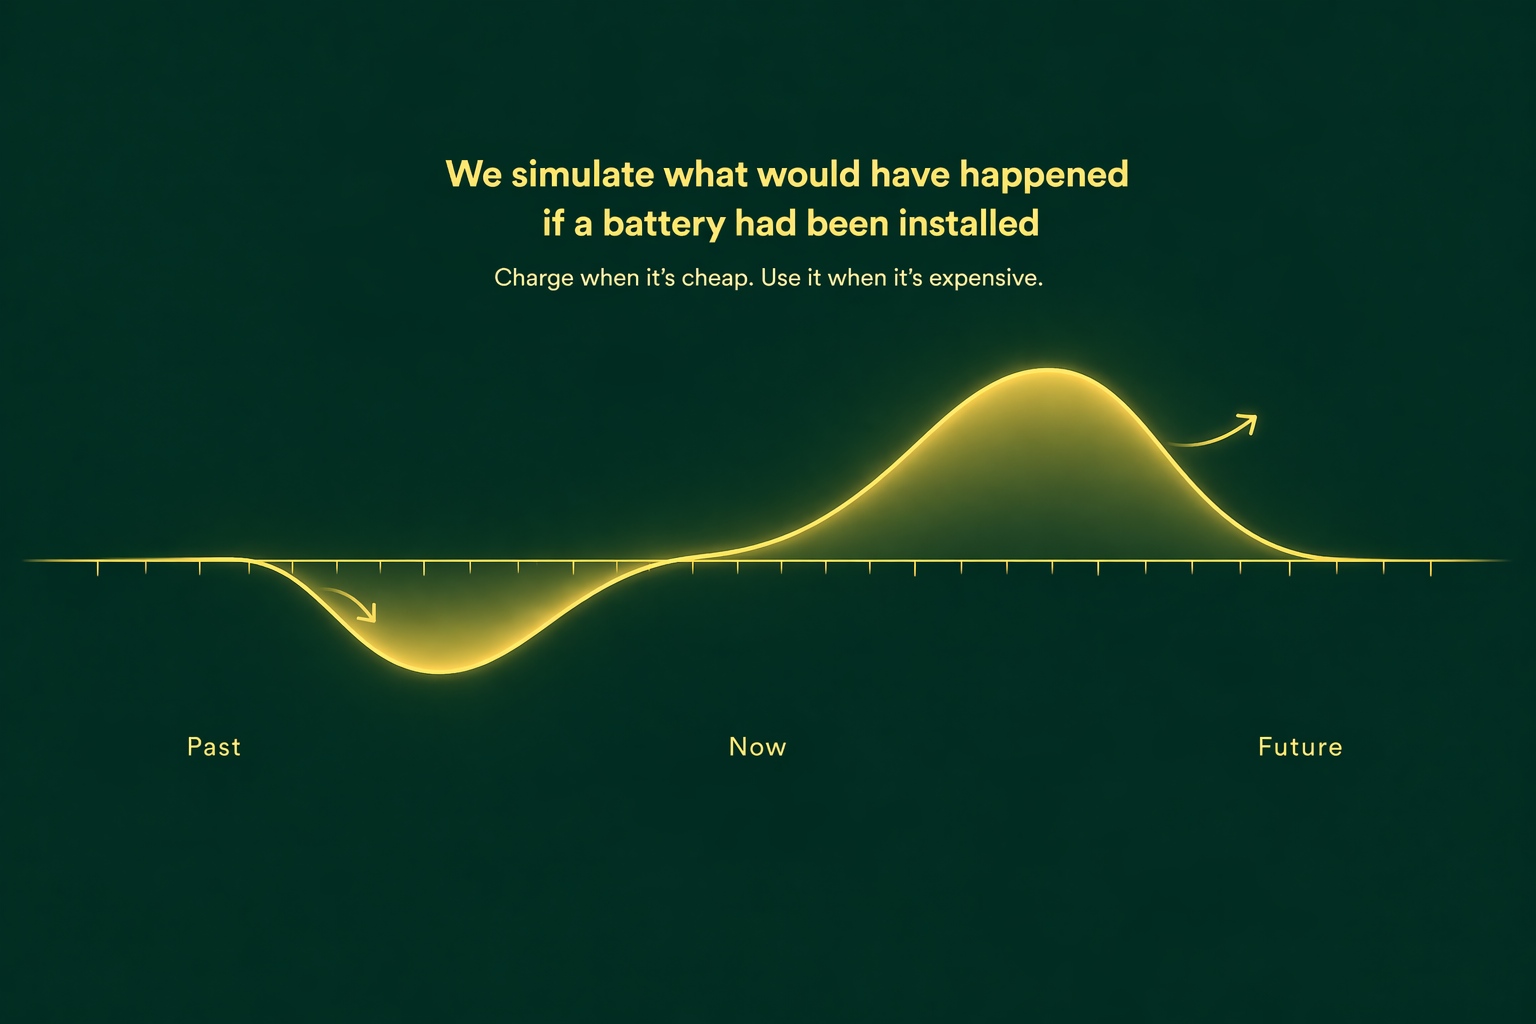
3. Battery
Shifting energy through time.
A battery doesn't generate energy — it changes when you use it.
We simulate a rolling decision process that:
- Charges when electricity is cheap (or when solar is available)
- Discharges when electricity is expensive
This effectively moves energy across time:
Use cheaper energy later, when it matters more.
Without solar, this smooths out price volatility. With solar, it increases how much of your own generation you actually use.
One timeline. Real interactions.
Everything is modelled on the same half-hourly timeline:
- Your usage
- Tariff prices
- Solar generation
- Battery decisions
That matters, because these things interact:
- Solar might generate when you're not using energy
- Prices might spike when you need power most
- A battery might bridge that gap
By keeping everything aligned in time, we can show:
What actually would have happened — not just what could happen.
What you get.
At the end of the simulation, you can clearly see:
- How much you would have paid on different tariffs
- How much solar would have reduced your grid usage
- How a battery would change both cost and timing
And most importantly:
Which combination actually works best for you.
Want to go deeper? The Methodology page documents the full simulation — the linear program that dispatches the battery, the satellite irradiance source for solar, the tariff data, and the simplifying assumptions we make.
Ready to replay your year?
Connect your smart meter and see what the last year would have cost on a different tariff, with solar, or with a battery.
See your actual costsTakes 2 minutes. No signup required. Your data is only used to run the analysis.